Table of Contents
Standard Followed
ASTM C 136
Objective
Following are the objectives of performing sieve analysis on coarse and fine aggregates:
- To determine the particle-size distribution of an aggregate sample
- To plot the gradation curve and check for the acceptability of the sample as per the recommendations of the standard.
- To determine the fineness modulus of coarse and fine aggregates
Related Theory
Coarse Aggregates:
The aggregate particles that retain on sieve #4 are termed as coarse aggregates. These may include gravels, crushed stones, etc.

Fine Aggregates:
They are the aggregate particles that pass sieve #4 but retain on sieve #200. Fine aggregates include a wide range of particle sizes. Specifically talking about sands, the grain-size distribution further classifies sand into coarse sand, medium sand, and fine sand.
Fineness Modulus:
It is an empirical number mathematically equal to the ratio of cumulative percentage retained on standard sieve #150 and 100. It is an index value that gives an idea of the coarseness or fineness of an aggregate sample in general. Mathematically,

Sieve Analysis:
Sieve analysis or mechanical straining is the process of determining the relative proportion of various particle sizes in an aggregate sample by passing the sample through a stack of standard sieves arranged in descending order of their opening sizes.
The weights retained on each sieve are noted and the cumulative percentage of sample passing through each sieve is calculated. Finally, a semi-logarithmic graph called gradation curve or ‘particle-size distribution curve’ is plotted, taking particle size as abscissa and cumulative percentage passing as ordinate.
It is to be kept in mind that gradation curves for coarse and fine aggregates are plotted separately and the samples are qualified or fall short of acceptability based on the standard’s criteria of gradation.
Importance of performing sieve analysis
Aggregates when used for construction activities are supposed to meet some gradation requirements imposed by the standard. Therefore, the performance of sieve analysis helps in qualifying an aggregate sample as fit for use.
Sieve analysis also helps in determining the fineness modulus of aggregates which proves instrumental in telling whether an aggregate sample is well-graded or not. In addition, the fineness modulus also indicates the surface area of the aggregate particles. However, there exists an inverse relation between aggregate surface area and the fineness modulus.

Coefficient of Uniformity:
For fine aggregates like sands, the uniformity coefficient can be determined from the gradation curve. It is mathematically given as,
Cu = D60/D10
Where D60 and D10 are the particle diameters corresponding to 60% finer and 10% finer, respectively.
Coefficient of Curvature:
It is also determined by citing the gradation curve. It is expressed mathematically as,
Cc=(D30)2 /(D10×D60)
Apparatus
- Standard set of sieves
- Mechanical sieve shaker
- Coarse aggregate sample
- Fine aggregate sample


Test Procedure
- The test size of the sample is specified by the standard and for coarse aggregates, the sample size to be taken is given in the following table. However, for fine aggregates, the standard suggests that a minimum of 300g of dried aggregate sample is ample for performing the test.
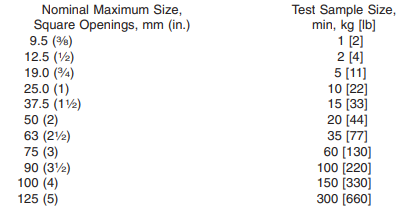
Source: ASTM C 136
- Oven-dry the aggregate sample at a temperature of 110 ± 5 °C and let the sample cool before performing the test.
- Arrange the standard set of sieves by stacking them on top of each other in descending order of their opening sizes. Place a pan at the bottom of the last sieve. It is to be remembered that the standard sieve set is different for coarse and fine aggregates and therefore, separate tests are to be conducted on them.
- Place the stacked sieves in the mechanical sieve shaker and start shaking the sieve set.
- Pour a portion of the aggregate sample on the top-most sieve cautiously, ensuring that the sieve does not get overloaded with the material. In no case should any particle be made to pass a particular sieve forcefully.
- Continue sieving for a duration till no particle originally retaining on a sieve slips through it into the sieve present just underneath.
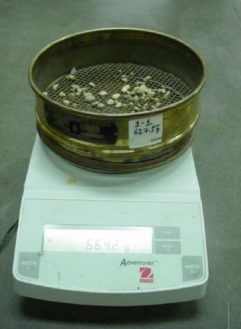
- Once the sieving operation is completed, remove the sieve stack and weigh the material retained on each sieve.
- Calculate the percentage weight retained on each sieve as

- Determine the cumulative percentage weight retained on each sieve.
- Determine the cumulative percentage passing also called cumulative percentage finer for each sieve as
![]()
- Plot the gradation curve between the particle sizes and cumulative percentage passing on a semi-logarithmic graph.
- From the graph, determine the requisite parameters related to aggregate particles.
- In order to verify whether an aggregate sample conforms with the standard, plot the limiting gradation curves and check whether the sample gradation curve lies between the two limiting curves. If it does so, the standard qualifies the sample, else the deficient particle sizes can be determined and added to the sample prior to using it for construction work. For limiting gradation curves, consult ASTM C33.
Observations and Calculations
For Coarse Aggregates
Weight of aggregate sample = gm.
| Sieve No.
in. (mm) |
Weight Retained
(gm) |
Percentage Weight Retained | Cumulative % Weight Retained | Cumulative
% Passing |
|
| 3 | 75 | ||||
| 1 1/2 | 37.5 | ||||
| 3/4 | 19 | ||||
| 3/8 | 9.5 | ||||
| 3/16 | 4.75 | ||||
| 3/32 | 2.36 | ||||
| Pan | Pan | ||||
Graph
Plot the gradation curve taking the size of particles on the x-axis and cumulative percentage passing on the logarithmic y-axis.
Plot the limiting gradation curves to qualify the sample as per the standard.
For Fine Aggregates
Weight of aggregate sample = gm.
| Sieve No.
(mm) |
Weight Retained
(gm) |
Percentage Weight Retained | Cumulative % Weight Retained | Cumulative % Passing | |
| #4 | 4.75 | ||||
| #8 | 2.36 | ||||
| #16 | 1.18 | ||||
| #30 | 0.6 | ||||
| #50 | 0.3 | ||||
| #100 | 0.15 | ||||
| #200 | 0.075 | ||||
| Pan | Pan | ||||
Graph
Plot the gradation curve taking the size of particles on the x-axis and cumulative percentage passing on the logarithmic y-axis.
Plot the limiting gradation curves to qualify the sample as per the standard.
Note: For a sand sample, the sieve analysis data can further aid in categorizing the sand sample.
% Sand=%age passing Sieve #4 and retaining on Sieve #200
- % Coarse-Grained Sand = % passing #4 and retaining on #10
- % Medium Coarse Sand = % passing #10 and retaining on #40
- % Fine Grained Sand = % passing #40 and retaining on #200
Coefficient of Uniformity =
Coefficient of Curvature =
Results
Fineness Modulus of Coarse Aggregates =
Fineness Modulus of Fine Aggregates =
Coarse Aggregate Sample qualification as per standard =
Fine Aggregate Sample qualification as per standard =
Test Precautions
- Particles that get stuck in the sieve mesh should not be forced through either way. This is because forcing the particles can either distort them or damage the mesh. In either case, the grain size results would be misleading.
- Care should be exercised while removing a sieve from the stack after the sieving operation.
- In case a sieve shaker is not used, the sieving operation is to be carried out manually for which horizontal motion of sieves instead of vertical motion.
- The sieves must be shaken for a minimum period of 10 minutes.
Discussion
Aggregates qualified as per standard are used in manufacturing concrete for construction operations. This is because the overall concrete strength and durability hinge on the gradation of aggregates used. A well-graded aggregate sample that conforms to the standard not only guarantees the longevity of concrete but also its reduced porosity and high early strength.
A flatter gradation curve that is smooth and concave in shape is indicative of a well-graded sample. A sharp decline in the slope of the curve shows poor gradation i.e., it signifies the fact that the sample is either short of some grain sizes or is deficient in the same.