Table of Contents
INTRODUCTION
Hydrology is the science that encompasses the occurrence, distribution, movement and properties of the waters of the earth and their relationship with the environment within each phase of the hydrologic cycle. Meteorological measurements are made to characterize the climate of that location and to supply meteorological information related to hydrologic processes. It is for this reason that meteorological data is especially important because the climate and weather of an area exert a profound influence on most hydrologic processes. (Srivastava 2008)
In the world of engineering it is important to know how the climatic factors are measured as well as the instruments used so that it can further aid engineers with interpreting meteorological data for use in the design of structures. An example would be the design of bridges; knowing the max head achieved by the canal/waterway so that the bridge can be placed safely above and therefore allows no water breaches or flooding. Another example would be the design of an urban drainage system where the average rainfall for the area plays a vital role in coming up with the size of the drainage network as well as the cross section of the drains.
With this in mind, the lecturer, Mr. Veecock instructed the class to conduct a visit to the Meteorological Observatory at the Botanical Gardens to observe and acquire knowledge on the basics of the instruments used including their methods of measuring and recording data, standard units, etc.
Meteorological Instruments Used In Hydrology
MANUAL RAIN GAUGE
A manual rain gauge is a cylinder with a funnel on top and a plastic tube in the middle. The standard is 10mm, readings below 0.1mm rainfall are considered trace; it can’t be read but there is still rainfall. Currently the manual rain gauge as shown below that is in the Botanical gardens is not working.


Figure 1: Pictures Showing the Manual Rain Gauge, Internally and Externally
[Photos taken by: Jitendra Bridgemohan 09/9/2015]
The Natural Siphon Recording Rain-Gauge (Float Type)
The natural siphon rain gauge is a type of self-recording rain gauge which has a mechanical arrangement by which the total amount of rainfall since the commencement of record gets automatically recorded on graph paper. This instrument has two sections; an upper section and a lower section. The upper section comprises an aperture and a deep set funnel through which the rain is collected (the collector). This section also acts as a cover for the recording mechanism assembly. The lower section, the base unit, comprises the recording and siphoning mechanisms. It also has a glass window located at the upper part which sits on the base unit such that the recording device can be viewed from the outside.
The rainfall collected in the funnel shaped collector is led into a float chamber, causing the float to rise. As the float rises, a pen attached to the float through a lever system records the rainfall on a rotating drum driven by a clockwork mechanism. A siphon arrangement empties the float chamber when the float has reached a preset maximum level. (Kanhir 2010)
The horizontal grid lines on the graph paper represent rainfall in millimeters whereas the vertical grid lines represent time in hours. The plot produced is cumulative rainfall vs time and the slope of the plot gives the intensity of rainfall for any given period of time, therefore, if a horizontal line is traced; the intensity of rainfall for that period of time is zero which means there was no rainfall for that period.

Figure 2: Picture Showing the Natural Siphon Recording Rain Gauge
[Photo taken by: Jitendra Bridgemohan 09/9/2015]
Soil Thermometers
A soil thermometer is used to measure the temperature of the soil. This information is vital in planting decisions for gardeners and farmers. When planting seeds, if the soil temperature is too low, the plant will die. Measurements of the soil’s temperature will give a clear indication if the soil is ready for planting. In the Botanical Gardens there are four soil thermometers at various depths: 5cm, 10cm, 20cm and 30cm respectively as shown below. The thermometers in the Gardens use the principle of thermal expansion to tell the temperature, as the temperature in the soil rises the mercury expands and rises a reading is taken.
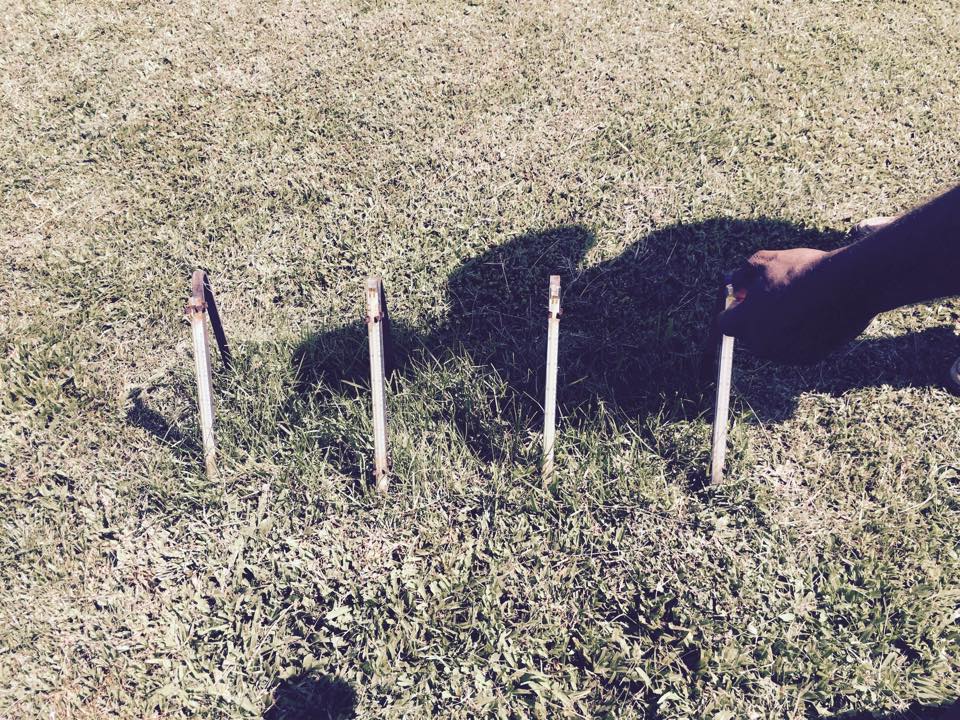
Figure 3: Picture Showing the layout of the Soil Thermometers at Varying Depths
[Photo taken by: Joseph Leo 09/9/2015]
THERMOMETER SCREEN/ STEVENSON’S SCREEN
A Stevenson screen or instrument shelter is an enclosure to shield meteorological instruments against precipitation and direct heat radiation from outside sources, while still allowing air to circulate freely around them. It forms part of a standard weather station. The Stevenson screen holds instruments that may include thermometers (ordinary, maximum/minimum), a hygrometer, a psychrometer, a dewcell, a barometer and a thermograph (Hocking 2000). Stevenson screens may also be known as a cotton region shelter, an instrument shelter, a thermometer shelter, a thermoscreen or a thermometer screen. Its purpose is to provide a standardised environment in which to measure temperature, humidity, dewpoint and atmospheric pressure.
The interior size of the screen will depend on the number of instruments that are to be used. A single screen may measure 76.5 by 61 by 59.3 centimetres (30.1 by 24.0 by 23.3 in) and a double screen 76.5 by 105 by 59.3 centimetres (30.1 by 41.3 by 23.3 in). The unit is either supported by four metal or wooden legs or a wooden post. The top of the screen was originally composed of two asbestos boards with an air space between them. These asbestos boards have generally been replaced by a laminate for health and safety reasons. The whole screen is painted with several coats of white to reflect sunlight radiation and will usually require repainting every two years.


Figure 4: Pictures Showing the Setup of the Stevenson’s Screen with various thermometers
[Photos taken by: Joseph Leo & Jitendra Bridgemohan 09/9/2015]
WIND VANE
The wind vane plays a minor but important role, because it measures wind direction. It is usually combined with the anemometer. Wind vanes are usually constructed so that the fluctuations in wind direction are communicated instantaneously to some form. In today’s technological society, the wind vane is not often used by people going about their day-to-day lives. Usually, high-tech weather systems can collect all the weather data needed without a traditional wind vane. However, some groups in society still use a wind vane on a regular basis. (Spilhaus 1953)

Figure 5: Picture Showing the Wind Vane at the Meteorological Observatory
[Photo taken by: Jitendra Bridgemohan 09/9/2015]
SUNSHINE RECORDER
A sunshine recorder is a device used to measure the amount of sunlight that is received by a specific area/region at any given time. This data is used for several applications, the most common being weather predictions and heat indexes. The engineering applications however with which these solar output data is used in are; designing for architectural efficiency and building considerations.
There are several types the device, differing in specifications, accuracy, dependability and method of functioning but, the operation remains generally the same. It quantifies the solar energy striking a certain part of the earth at a certain time, measuring both the strength and volume. (Srivastava 2008)
The specific type of sunshine recorder found at the Meteorological Observatory is the Campbell –Stokes Recorder. This uses a glass canister or sphere that directs sunlight onto a chemically treated card. The sunlight burns or chars a mark onto the card, called a trace that is measured and converted into duration of time. The elevation of the sun changes several times throughout the year, hence in most cases there are different cards used. The cards are changed with respect to the different seasons and are made to fit with the elevation of the sun.
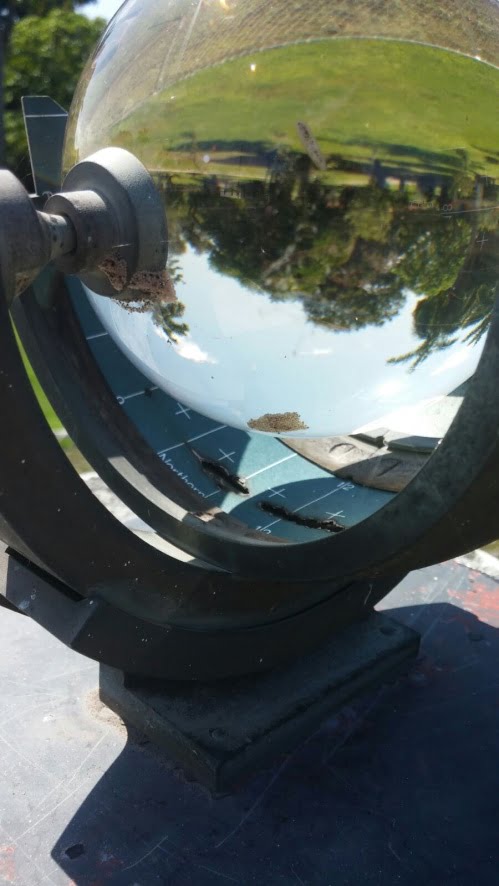

Figure 6: Picture Showing the Sunshine Recorder and the chemically treated reading card
[Photos taken by: Jitendra Bridgrmohan 09/9/2015]
Tipping Bucket Rain Gauge
The tipping bucket rain gauge consists of a funnel that collects and channels the precipitation into a small seesaw-like container. After a pre-set amount of precipitation falls, the lever tips, dumping the collected water and sending an electrical signal. An old-style recording device may consist of a pen mounted on an arm attached to a geared wheel that moves once with each signal sent from the collector. In this design, the wheel turns the pen arm moves either up or down leaving a trace on the graph and at the same time making a loud click. Each jump of the arm is sometimes referred to as a ‘click’ in reference to the noise. The chart is measured in 10 minute periods (vertical lines) and 0.4 mm (0.015 in) (horizontal lines) and rotates once every 24 hours and is powered by a clockwork motor that must be manually wound. (Hocking 2000)
The tipping bucket rain gauge is not as accurate as the standard rain gauge because the rainfall may stop before the lever has tipped. When the next period of rain begins it may take no more than one or two drops to tip the lever. This would then indicate that pre-set amount has fallen when in fact only a fraction of that amount has actually fallen.
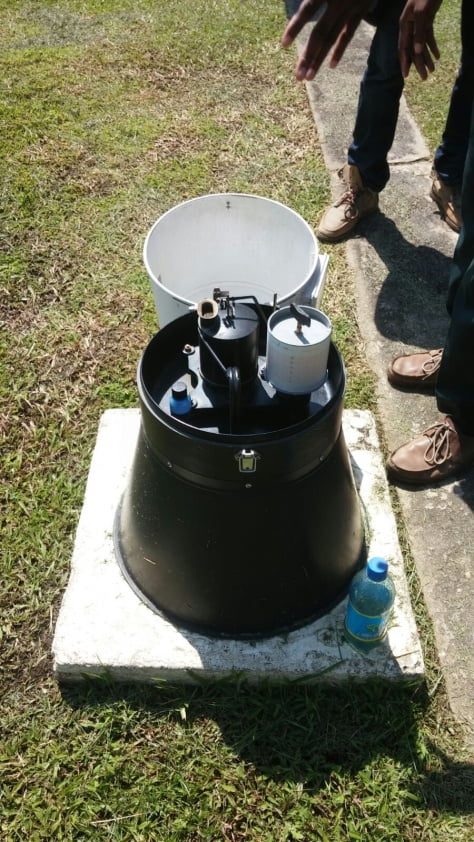
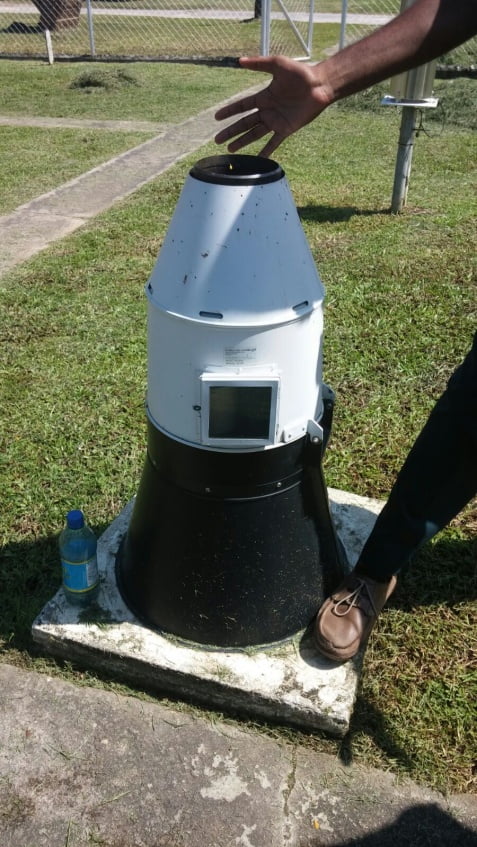
Figure 7: Picture Showing the Tipping Bucket Rain Gauge, Internally & Externally
[Photos taken by: Jitendra Bridgrmohan 09/9/2015]
Automatic weather Station
An automatic weather station (AWS) is an automated version of the traditional weather station, either to save human labour or to enable measurements from remote areas. An AWS will typically consist of a weather-proof enclosure containing the data logger, rechargeable battery, telemetry (optional) and the meteorological sensors with an attached solar panel or wind turbine and mounted upon a mast. The specific configuration may vary due to the purpose of the system. The system may report in near real time via the Argos System and the Global Telecommunications System, or save the data for later recovery. The data-logger is the heart of the Automatic Weather Station. (Hocking 2000)
The main functions of a data-logger are:
- Measures: the data-logger collects the information of each sensor and archives it.
- Calculation: the data-logger processes most of the meteorological data for the users (average, min, max…).
- Data storage: the data-logger saves all the data either on its own memory or on an SD memory card.
- Power supply: the data-logger manages the power supply of the Automatic Weather Station such as solar panel.
- Communication: the data-logger does manage the communication protocols with the remote server. The different communication protocols are usually GSM, GPRS, RTC, WIFI, uSD, and RS232.
Most automatic weather stations have:
- Thermometer for measuring temperature
- Anemometer for measuring wind speed
- Wind vane for measuring wind direction
- Hygrometer for measuring humidity
- Barometer for measuring atmospheric pressure
- Ceilometer for measuring cloud height
- Present weather sensor and/or visibility sensor
- Rain gauge for measuring liquid-equivalent precipitation
- Ultrasonic snow depth sensor for measuring depth of snow
- Pyranometer for measuring solar radiation (Hocking 2000)
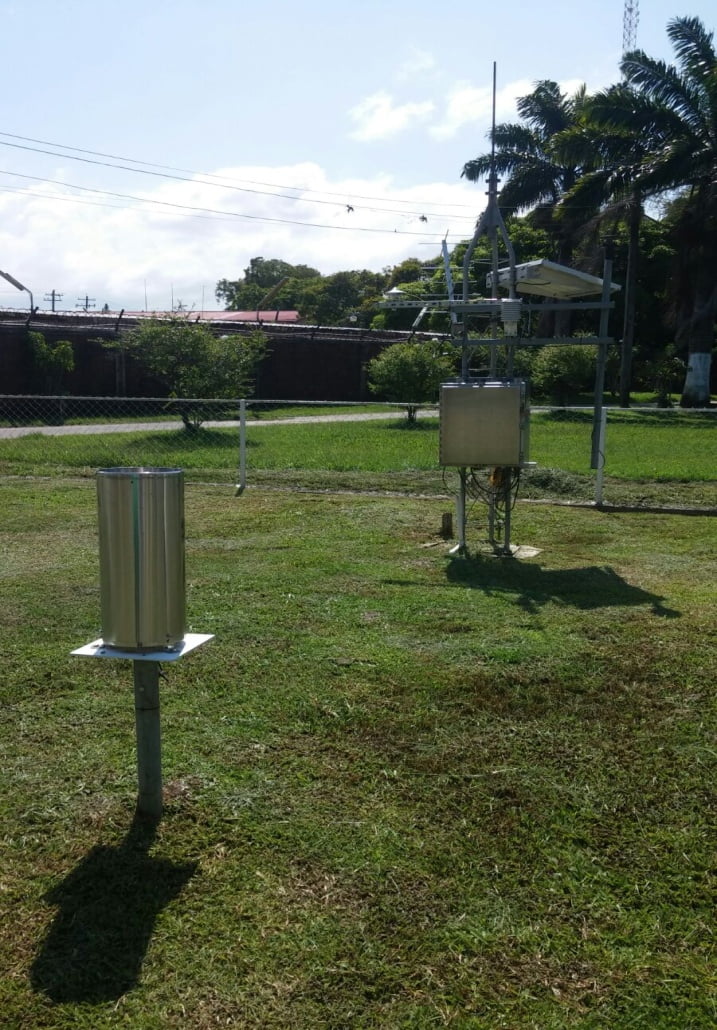
Figure 8: Picture Showing the Automatic Rain Gauge on the left hand corner, and the Automatic Weather Station to the right
[Photo taken by: Jitendra Bridgrmohan 09/9/2015]
Anemometer
An anemometer is a device used for measuring wind speed, and is a common weather station instrument. The term is derived from the Greek word anemos, which means wind, and is used to describe any wind speed measurement instrument used in meteorology. The first known description of an anemometer was given by Leon Battista Alberti in 1450. (Spilhaus 1953)
It consists of four hemispherical cups, each mounted on one end of four horizontal arms, which in turn were mounted at equal angles to each other on a vertical shaft. The air flow past the cups in any horizontal direction which turns the shaft in a manner that was proportional to the wind speed. Therefore, counting the turns of the shaft over a set time period produces the average wind speed. On an anemometer with four cups, it is easy to see that since the cups are arranged symmetrically on the end of the arms, the wind always has the hollow of one cup presented to it and is blowing on the back of the cup on the opposite end of the cross.
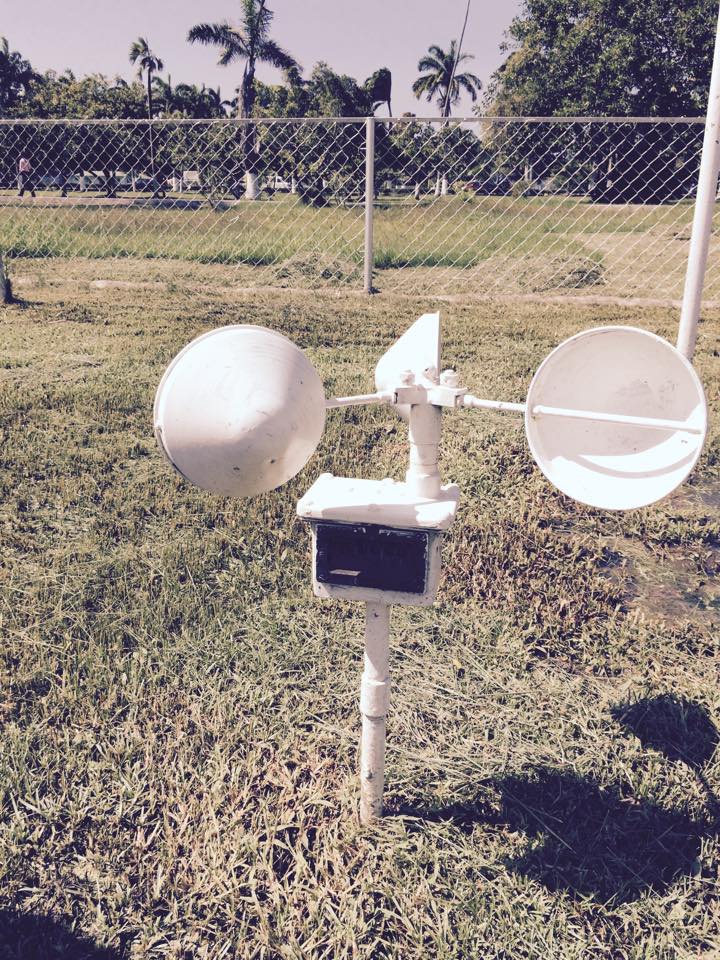
Figure 9: Picture Showing the Anemometer with a digital display relaying the speed
[Photo taken by: Jonathan Hohenkirk 09/9/2015]
Evaporation Pan and Six’s Thermometer
Heat, atmospheric pressure and imbalances of humidity between the land and the atmosphere cause water to be evaporated from the surface of the Earth. The natural rate of evaporation is of importance to Guyana particularly because it is used in determining humidity.
The evaporation pan is a simple instrument used in measuring the rate of evaporation. It consists of a large steel pan to hold water, a still well a level brass cylinder) within the pan which provides an undisturbed water surface and a hook gauge. The hook gauge is a small mechanism that lowers a hook until it breaks the surface of the water and a micrometer cylinder records that level. (Swus 2009)The pan is used by filling it with some water at the start of the day and recording the level, at a later time the water level is measured again to determine how much has evaporated against the time since the first level was taken. Rainfall must be factored into the equation and is subtracted from the first level if any.
In measuring evaporation it is also important to know the average temperature that caused the evaporation. A Sixes thermometer was a part of the evaporation pan setup.
A Six’s thermometer is a U-shaped glass tube thermometer with temperature scales along either arm of the “U” – one for maximum temperature and one for minimum temperature. The arms of the “U” have glass bulbs at their top; the maximum bulb is a vacuum and the minimum bulb contains liquid alcohol. Separating these two in the middle of the U-shaped tube is mercury. If the temperature rises them mercury will be pushed up the maximum scale and vice versa. The two readings are given by metal markers which only move when being pushed by the mercury; at the end of a period readings are taken and then the markers must be reset.
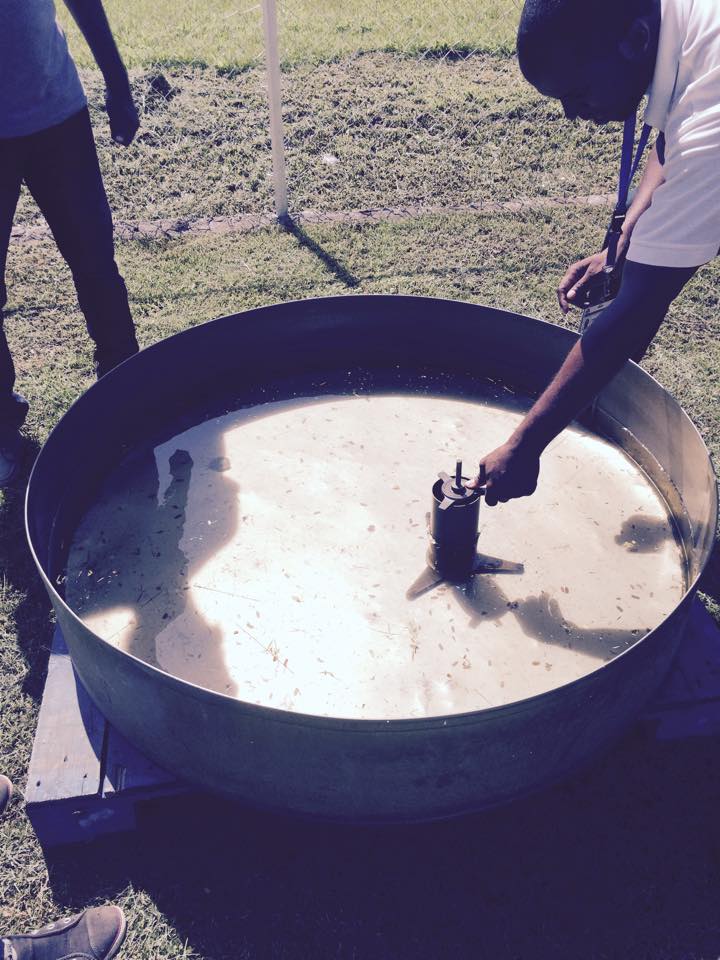

Figure 10: Showing the Evaporation Pan and the non functional Six’s Thermometer
[Photos taken by: Jonathan Hohenkirk & Joseph Leo 09/9/2015]
Mercury Barometer
This is an antique instrument used to measure atmospheric pressure. It is being phased out in favor of smaller, cheaper and more accurate electronic barometers and because of the negative environmental effects of mercury. (Bill 2010)
The mercury barometer consists of a glass tube closed at the top with an open mercury-filled base suspended in a reservoir of mercury. There is some space at the top of the tube which is a vacuum which is called the Torricellian Vacuum. The pressure of the atmosphere weighs down on the mercury in the reservoir and pushes it upwards into the pressure-less vacuum atop the tube. This rise can be equated to certain amount of increase in atmospheric pressure. The amount is measured using a parallel-mounted scale graduated in Mercury Inches (inHg) or millimeters of Mercury (mmHg).
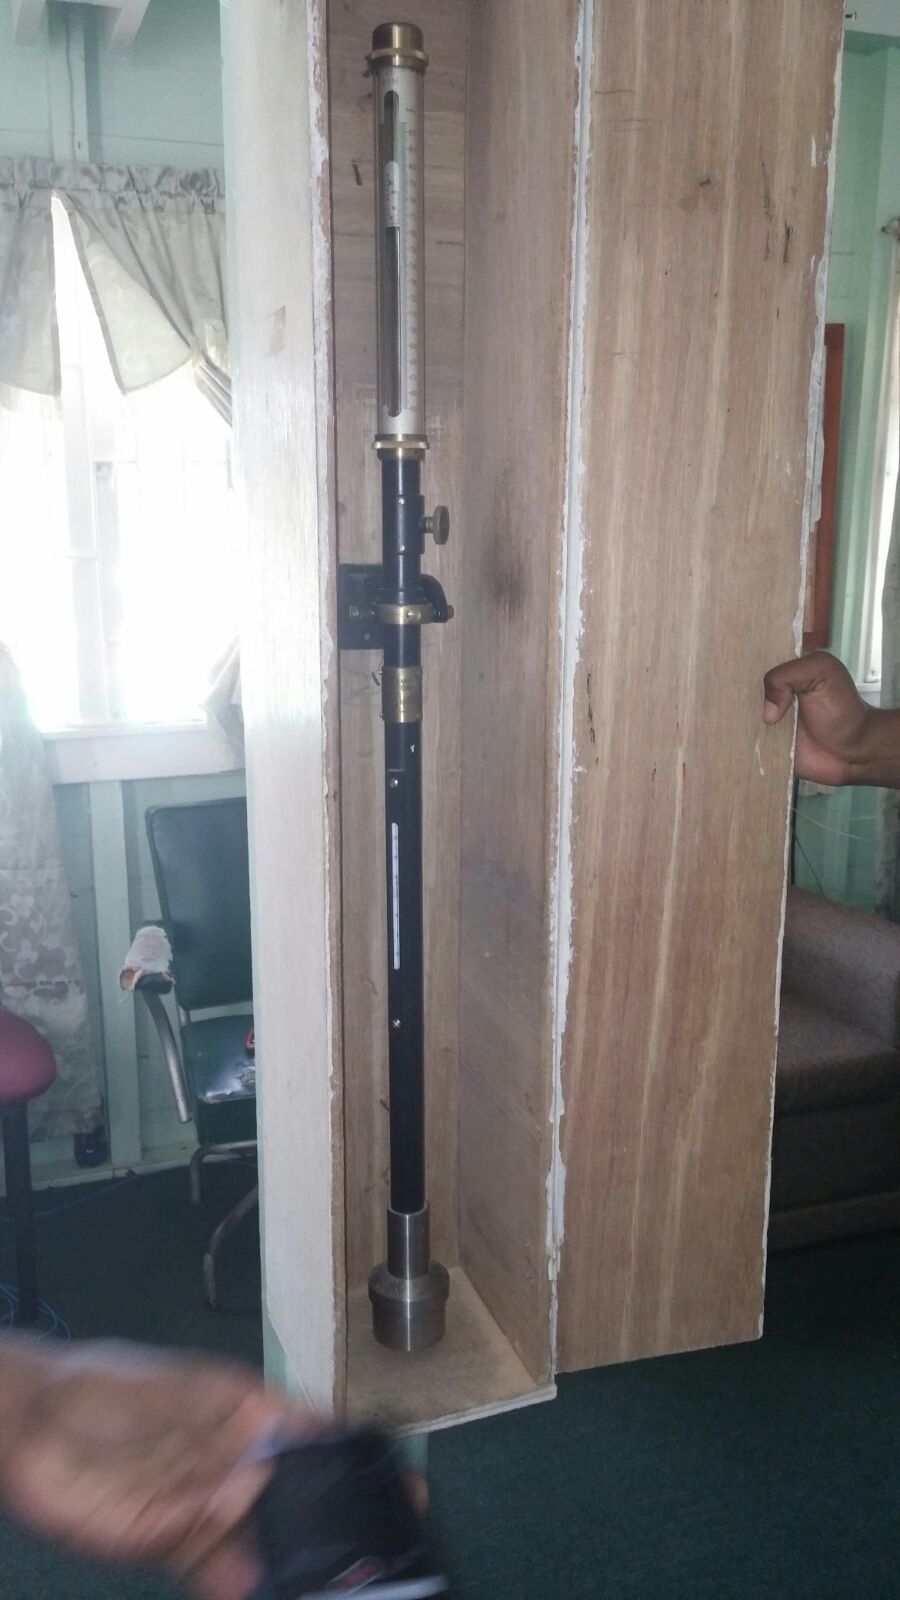

Figure 11: Picture Showing the Existing Mercury Barometers
[Photos taken by: Jitendra Bridgemohan & Joseph Leo 09/9/2015]